Data Sketches
Data Visualization for React Developers

3 hours, 21 minutes
CC

Course Description
Learn to design simple visualizations with D3.js and React! In this course, follow along with Shirley Wu as she goes through fundamental visualization theories and shows how to apply them to different chart types. Plus, Shirley demonstrates the best practices on how to use D3.js to generate the data for these visualizations, and how to use React to render them.
Preview
Course Details
Published: September 10, 2018
Rating
Learning Paths
Topics
Learn Straight from the Experts Who Shape the Modern Web
Your Path to Senior Developer and Beyond
- 300+ In-depth courses
- 24 Learning Paths
- Industry Leading Experts
- Live Interactive Workshops
Table of Contents
Introduction
Section Duration: 5 minutes
 Shirley Wu introduces herself and the goals for the Data Visualization for React Developers course.
 Shirley talks introduces the three workshops she has created with Frontend Masters, what material they cover, and the order she recommends in taking those classes.
The Basic Chart Types
Section Duration: 11 minutes
 Shirley outlines the agenda for the course. Data types are introduced, as well as common charts and what data is best represented with them.
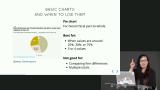 Shirley covers what a pie chart can show effectively with data, and when to avoid them.
 Shirley reveals the data visualization project an aggregation of weather data charts that will be built throughout the course.
The Making of a Chart
Section Duration: 1 hour, 22 minutes
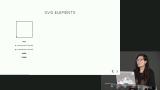 Shirley explains what a SVG is, the elements that it consists of, and its coordinate system.
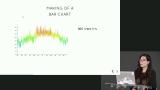 Shirley investigates how to recreate the weather data charts with SVG rectangles and paths.
 The audience is instructed to inspect SVG charts in an an attempt to become familar with the format.
 Shirley unveils several capabilities in the virtual notebook editor to update the SVG shapes.
 Shirley introduces D3, and why D3's API may seem so intimidating. The scales and shapes modules are covered in detail in this section, because they allow the user to translate raw data to SVG shapes. A linear scale example is discussed, and other scales commonly used are covered.
 The audience is asked to apply D3 scales to create a bar chart.
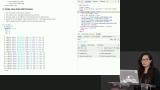 Shirley walks through the solution for Going from Data to SVG Exercise using D3's extent(), scaleTime(), scaleLinear(), and map() functions to map temperature data to a visual representation. - NOTE: Remove "ask for questions" remark by Shirley.
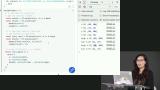 After building the chart solution, Shirley applies a color scheme using D3's scaleSequential(), and a D3 module used to provide a sequential color scheme.
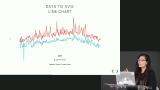 Shirley introduces d3.line() that outputs a path string necessary to draw line charts.
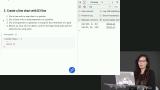 In this exercise, the D3 line API is utilized to create a line chart.
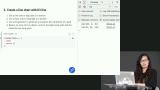 Shirley walks through the Creating Line Charts Exercise.
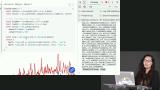 Shirley demonstrates how to generate a radial chart using D3's arc() function.
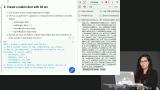 Shirley explains the exercise on how to construct a radial chart, and gives a hint about how to approach the problem.
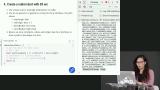 Shirley walks through the solution to the Radial Chart Exercise, and introduces color at the end.
Rendering with React
Section Duration: 40 minutes
 Shirley reviews the data preparation, and the layout calculation portions of D3 API. In particular, why D3 is so powerful, tools to interact with the D3 Documentation, and several D3 libraries are introduced.
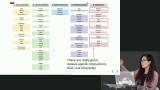 Shirley introduces DOM manipulation and Interactions within D3, where React will become useful.
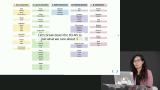
 Shirley reviews the division of responsibilities, as well as where the data is calculated within the React application. When lecturing on where data is calculated, the pros and cons of getDerivedStateFromProps, Render, and componentDidMount & componentDidUpdate are examined. The assumptions are introduced, and main takeaways are also concluded.
 In this exercise, students draw a bar chart with React and D3.
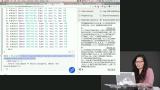 Shirley live codes the solution to the React and Bar Chart Exercise, and then walks through the architecture of the app, including App.js.
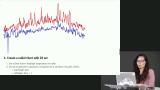 Shirley live codes how to implement a radial chart within a React project. A different way of implementing the SVG in the React project using componentDidUpdate()/componentDidMount() is also introduced.
The Finishing Touches
Section Duration: 1 hour
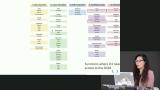 Shirley discusses the last two portions of the API: the finishing touches, and interactions. The functions within D3 that need access to the DOM are covered, and words of caution are given when interating with the DOM.
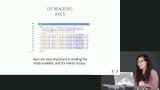 Shirley dicusses how to implement axes in React to make your SVG visual aids more meaningful.
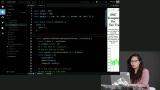 In this exercise, Shirley walks through the incorporating axes into the bar chart that was previously created with React.
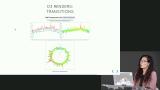 Shirley gives the recommendation that React not manage the attributes D3 is transitioning. Reasoning, and alternatives are given to bypass this issue.
 Shirley introduces brush() from D3, which allows the user to highlight graphs and return data for mouse and touch events using SVG.
 After discussing how to implement D3 brush, Shirley live codes an example showing how to add brush interactivity to a chart.
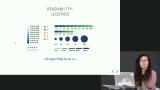 Shirley introduces D3 legends and annotation functions, and additional resources that help with readability of your visual aid.
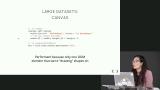 Shirley introduces canvas for working with large datasets in data visualizations.
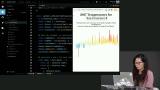 After reviewing how to create a bar chart in canvas, Shirley shows how to generate a radial chart in canvas with D3.
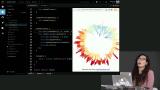 After answers a question about possibility of implementing D3 brush() in canvas, and the application of brush() in a radial chart, Shirley wraps up the course and thanks the students for attending.
Earn a Completion Certificate
After completing this course, you'll receive a certificate of completion that serves as proof of your achievement, showcasing your expertise, and commitment to professional development. You can easily share this certificate on your LinkedIn profile to highlight your new skills and demonstrate continuous learning to potential employers and professional connections.