Matt DesLauriers
Freelancer
The "Volume Meter" Lesson is part of the full, Web Audio Synthesis & Visualization course featured in this preview video. Here's what you'd learn in this lesson:
Matt demonstrates using the waveform data to create a visualization based on the volume of the audio track. The advanced meter demo uses the Web Audio API to help split the audio track into different colored frequency bands to help create a more interesting visualization. A brief discussion regarding the BiquadFilterNode is also covered in this segment.
[00:00:00]
>> Now one more thing I'll talk about with waveforms before I move into frequency analysis. And splitting up a track into different tones, and pitches and things like that. One more thing is metering and sort of getting the level of a track. We can use the waveform data to get the overall signal the loudness sort of the volume.
[00:00:19]
And make some sort of visualization based on that. So for example here, we can see that the circle is just changing size based on the overall signal of the entire track. As it's louder, the circle gets bigger, as it's quieter, the circle gets smaller. So I'm gonna open that one up.
[00:00:41]
And this is doing pretty much the same sort of stuff as we've seen before, it's creating a new Analyzer node. It has another thing here called smoothing time constant which is another property of the Analyzer node. Which allows us to just have a bit of a smoother result from one frame to the next.
[00:00:59]
It's a little bit like the interpolation or the smoothing that I was talking about before except the web audio API actually includes this built in. So that you can get a little bit of time smoothing between frames. And then if we go down there's this additional function that I've added here, which is in the snippets so if you're going to the course repo.
[00:01:22]
Here it is. Inside the code snippets, you'll find this it's called the root mean squared. And this is basically just gonna give us the strength of the signal and value that goes between 0 and 1. And so if we scroll down, to where we're doing our Analyzer node.get float time domain data.
[00:01:46]
Once we get the data, we pass that data into the root mean squared signal. And that's going to give us some value between 0 and 1. It's probably gonna be very small the number that we get. Because if the value is 1, it means it's blasting audio and our eardrums would be completely pierced.
[00:02:03]
So you just probably are gonna want to scale that by some value. And then maybe further scale it by some pixel value to get an actual pixel size of how big the circle should be based on that signal.
[00:02:15]
[MUSIC]
[00:02:19]
And so already we're starting to get into this visualization of the audio aspect. So, based on this one, we can just go one step further. And we can actually split that into different bands. So we can say well, what's the strength of the audio at these different frequency bands?
[00:02:42]
So, when we talk about low and high frequencies such as a treble, cymbal crashes and high hats. Versus a really low frequency sound like a kick drum, or guitar pluck, those are the different frequency bands. And so we can start to split the track up into those bands.
[00:02:59]
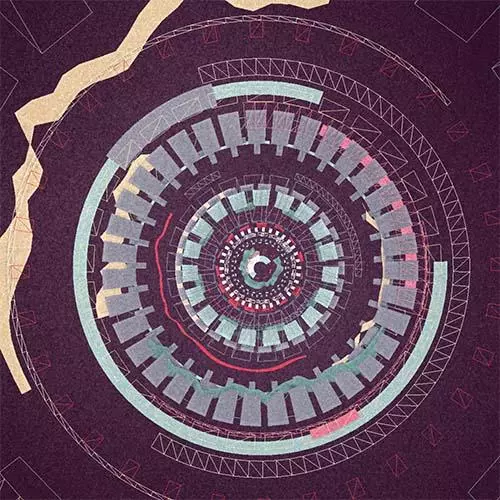
Or we can start to visualize the signal of those different bands and potentially create a more interesting audio visualization. So now suddenly here we're visualizing this piano sound. And we're seeing how the track is actually changing its form in terms of its frequency.
[00:03:16]
[MUSIC]
[00:03:25]
So, just to skim this one, it's a little bit more advanced as well. The next thing I'm gonna talk about after this is frequency and all sort of distill what this frequency stuff is all about. But just so you can see, this is one way of splitting up the frequency.
[00:03:40]
And it's using the Web Audio API itself. So instead of having to do a bunch of frequency math and having to go into the frequency arrays and figure them all out. We're just gonna use the same metering that we used in the last demo. Just the root mean squared, except we're gonna use several different audio nodes.
[00:04:00]
Where the meter is on each of those different audio nodes. And so we start with different bands of frequency, with different colors assigned. And again I'll talk a little bit more about what this frequency value means it's in hertz. But this will be to different bands of tones sort of.
[00:04:18]
So these lower numbers represent lower frequency, and these higher numbers represent higher frequency sounds. And then each of those bands, we're gonna create a new Analyzer for that specific band. We're gonna create a new float array for that specific band, and also what's called a filter Node AN biquad filter.
[00:04:40]
And what this can do, is that it's an audio node where any signal that gets passed into it, we can shape the signal. So that we only end up taking let's say, a certain range of frequencies. Let's say just the low end frequencies, and all the others get cancelled out to zero.
[00:04:58]
And what that means, is that we can then pass that signal on to the Analyzer. And then use the analyzer just as we were, the root mean squared, in order to actually get a strength of just a single band of frequency. And so this is a great way to do audio visualization.
[00:05:15]
It's actually I would say the way that might be preferred, at least by me, I really have started to prefer this way. One of the reasons is that it's very adjustable, very easily adjustable, and it just works out of the box with Web Audio API. It's a little bit more setup because you have to create an analyzer for each band of frequency, and you have to do a few extra things.
[00:05:39]
But it supports this really nice sort of smooth fall off because of these filters that we're using. But I'm not gonna go into this crazy depth of the biquad filter because it's a whole wormhole. But I would highly recommend if you wanted to continue along this path. And making these really smooth and sort of polished audio visualizers, you might wanna look into this biquad filter.
[00:06:04]
And just to show you the API docs here for a sec, there we go. It has a lot of these different types of filtering mechanisms. So it allows us to cut off low end frequencies or to cut off high end frequencies. Or the one we're using is just a bandpass which means only allow a certain band of frequencies to pass through.
[00:06:27]
Or others where it's a knotch filter, which is kind of the opposite of a bandpass. It only allows everything except the band that we specified. And then we can very easily with the the audio params just like the gain node. We can adjust those values in terms of the bandwidth, and how much of the frequency we wanna take, or how much we wanna cut off.
[00:06:52]
So this biquadfilter is really powerful, something to look into for a little bit later. And for just your own sort of exercises perhaps.