Data Visualization for React Developers

Shirley Wu

Shirley Wu

Data Sketches
3 hours, 21 minutes CC
Data Visualization for React Developers

Course Description

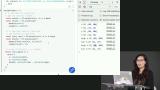
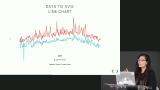
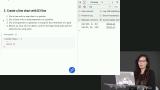
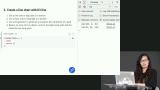
Learn to design simple visualizations with D3.js and React! In this course, follow along with Shirley Wu as she goes through fundamental visualization theories and shows how to apply them to different chart types. Plus, Shirley demonstrates the best practices on how to use D3.js to generate the data for these visualizations, and how to use React to render them.

This course and others like it are available as part of our Frontend Masters video subscription.

Preview
Close

Course Details

Published: September 10, 2018

Learn Straight from the Experts Who Shape the Modern Web

Your Path to Senior Developer and Beyond
  • 200+ In-depth courses
  • 18 Learning Paths
  • Industry Leading Experts
  • Live Interactive Workshops
Get Unlimited Access Now

Table of Contents

Introduction

Section Duration: 5 minutes

The Basic Chart Types

Section Duration: 11 minutes

The Making of a Chart

Section Duration: 1 hour, 22 minutes

Rendering with React

Section Duration: 40 minutes

The Finishing Touches

Section Duration: 1 hour

Learn Straight from the Experts Who Shape the Modern Web

  • In-depth Courses
  • Industry Leading Experts
  • Learning Paths
  • Live Interactive Workshops
Get Unlimited Access Now