Software Engineer & Educator
Web App Performance

5 hours, 17 minutes
CC

Course Description
Learn to identify and resolve performance issues in your web apps! You'll get an overview of Web Vitals and how to identify and monitor poor performance. Optimize loading CSS, JavaScript, and images with lazy loading, and dive into the basics of HTTP, browser cache, and service workers. Learn advanced techniques like preloading, fetch priority, HTTP Early Hints, and browser performance APIs like Performance & Navigation Timing API and PerformanceObserver API.
Preview
Course Details
Published: July 30, 2023
Rating
Learning Paths
Learn Straight from the Experts Who Shape the Modern Web
Your Path to Senior Developer and Beyond
- 300+ In-depth courses
- 24 Learning Paths
- Industry Leading Experts
- Live Interactive Workshops
Table of Contents
Introduction
Section Duration: 33 minutes
 Maximiliano Firtman begins a course with a summary of the topics covered. After understanding the problems with poor performance and tools for measuring performance, the course will work through basic optimizations, advanced performance techniques, and the Performance APIs available in web browsers.
 Max demonstrates the average website load time and begins discussing performance-related problems. Slow-loading websites are directly related to traffic loss and reduced conversion rates.
 Max discusses the implications performance has on the mobile web. Mobile usage statistics are shared, and markets worldwide are compared. Analyzing a website's audience helps developers and stakeholders understand the implications performance optimizations will have on creating successful conversions.
Metrics & Tools
Section Duration: 1 hour, 12 minutes
 Max walks through the standard metrics for measuring performance. These include time to first byte, first paint, page load, first interactive, time to interactive, and largest contentful paint. Some metrics are browser-centric, while others are user-centric metrics. Prioritizing user-centric metrics will have a more significant impact on the perceived performance of a website.
 Max introduces the Core Web Vitals. These metrics aggregate real user metrics across the 75th percentile over mobile and desktop web usage. The metrics are the largest contentful paint (LCP), first input delay (FID), and cumulative layout shift (CLS).
 Max demonstrates how to measure real-world performance using Google's PageSpeed Insights tool. LCP, FID, and CLS goals are discussed, and the Chrome UX Report website is introduced.
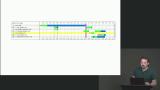 Max explains why the waterfall chart is one of the most powerful tools for optimizing website performance. The chart visualizes how a website's assets are loaded and the duration of each step in the loading process. The performance tab in the Chrome Dev Tools is also demonstrated in this lesson.
 Max demonstrates WebPageTest, a free cloud-based performance tool for auditing site performance. The desired metrics and test environment can be configured. The resulting interactive report allows developers to analyze the performance with a similar set of tools as the Chrome Dev Tools performance tab.
 Max explains that most performance optimizations occur on the front end. Optimizing the back end has less impact and is not as easy as front-end optimizations.
 Max walks through the project setup and runs an initial Lighthouse report. The project uses a simple Express server to which helps simulate some real-world network conditions. The performance issues of the website will be addressed throughout the rest of the course.
Basic Optimizations
Section Duration: 1 hour, 14 minutes
 Max explains the entire data roundtrip from when a user enters a domain name in the browser to the content rendered on the screen. Understanding all the steps in a network request helps identify where performance bottlenecks can arise.
 Max shares a brief history of HTTP, HTTP/2, and HTTP/3. Understanding the fundamentals of requests and responses helps developers recognize network performance pitfalls.
 Max explains the client-side caching options available when a browser requests a resource. When the browser finds a requested resource in the cache, it will check to see if it's expired. Expired resources will be loaded if the cache header indicates they are unmodified. Otherwise, a new resource will be requested.
 Max introduces Back/Forward Cache, or bfcache. Assets are cached between pages speeding up the navigation. The Page Navigation API can be used to open/restore connections or abort pending transactions between pages.
 Max explains the performance gains service workers can provide since they can intercept network requests and provide faster offline experiences for applications.
 Max cautions about using too many render-blocking resources, which must be loaded before the page content appears and is interactive. The implications of long-executing JavaScript and animations are also discussed in this lesson.
 Max covers some basic server-related performance techniques that developers should verify are in place. Checking response headers for text-based files will indicate GZIP is enabled. Leveraging cookieless domains and reducing redirects will also increase performance.
 Max wraps up the basic optimization recommendations by demonstrating how blocking CSS can reduce page performance, and JavaScript should be deferred as long as possible. A few tips for optimizing images and web fonts are also discussed in this lesson.
Advanced Optimizations
Section Duration: 1 hour, 34 minutes
 Max explains why optimizing the first load has a significant perceived performance gain. The quicker a user sees content, the faster a site feels. One strategy for this is inlining CSS and JS code required for above-the-fold content. HSTS preloading is also discussed in this lesson.
 Max preloads the primary image on the page to improve the First Contentful Paint metric. Preloading an asset with a link element and rel="preload" will speed up the discovery process and potentially have the asset in the browser cache by the time the application requests it.
 Max introduces the fetchpriority attribute and explains how it signals high or low-priority image fetches. This can be useful when applied to <img> elements to signal images that are "important" to the user experience early in the loading process.
 Max demonstrates HTTP Early Hints, allowing the server to return a 103 response along with any assets the browser can begin loading while waiting for the server processing to finish and the final 200 response to be returned.
 Max discusses strategies for optimizing data transfer performance between the client and server. Leveraging HTTP/3 (known as QUIC) will reduce the number of requests required to load a page. Utilizing more efficient compression algorithms like Brotli can also increase performance.
 Max walks through the modern image formats and their performance advantages to web applications. SVG is text-based and can be easily embedded in source code, eliminating additional network requests. Formats like WebP, AVIF, and Zopfli PNG offer better compression algorithms leading to smaller final sizes for high-quality images.
 Max explains the immutable Cache-Control value indicates to the browser an asset never expires. Using the dns-prefetch and preconnect options in header link elements is also explained in this lesson.
 Max explores the lazy loading and decoding options available with images. Lazy loading automatically defers the loading of an image, reducing its priority. The font-display CSS property indicates to the browser how text should be rendered when loading a web font.
 Max discusses how HTTP Client Hits allow the browser to expose device information to the server by using a meta tag in the HTML. This information helps the server decide which asset to return.
 Max suggests moving heavier tasks, like image processing or video encoding, to the WebAssembly thread, freeing up the main thread for user interaction. Removing legacy code and providing a consistent loading experience will also increase the overall perceived feel of the application.
 Max reviews the lighthouse score for the application now that some performance optimizations have been applied. A question about how other frameworks like Next.js defer JS execution on the initial page load is also discussed in this lesson.
Performance APIs
Section Duration: 31 minutes
 Max introduces the Performance & Navigation Timing API. The properties and methods in this API give developers precise details about a page's performance and the metrics can be used for creating robust custom reports.
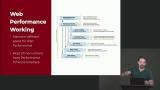 Max shares the supported entry types in the PerformanceObserver API, allowing developers to access metrics like the core web vitals directly from JavaScript.
 Max covers a few smaller but useful optimization APIs. For example, the save data flag indicates the user would like to use as little data as possible.
 Max explains why requestAnimationFrame is more performant and reliable than setTimeout or setInterval. The isInputPending property is helpful for occasionally checking if input from the browser needs to be processed during a long-running JavaScript task. If so, the thread can be released and continued later.
 Max discusses use cases for the requestIdleCallback method. Developers can defer code execution until the browser has idle time or a specified time. Script yielding allows the browser to temporarily take control of the main thread and immediately execute a callback function after it has finished.
Wrapping Up
Section Duration: 10 minutes
 Max wraps up the course by summarizing the topics covered and sharing additional advice for optimizing performance in web applications. Tips for creating a performance-focused culture within a company are also shared in this lesson.
Earn a Completion Certificate
After completing this course, you'll receive a certificate of completion that serves as proof of your achievement, showcasing your expertise, and commitment to professional development. You can easily share this certificate on your LinkedIn profile to highlight your new skills and demonstrate continuous learning to potential employers and professional connections.

What They're Saying
🚀 Just wrapped up an insightful course learning web app performance with Master.dev!
🌐 Key Takeaways:
- Metrics like First Paint and Time to Interactive are crucial.
- Optimize for mobile performance for significant impact.
- Tools like PageSpeed Insights and WebPageTest are essential for audits.
- Frontend optimizations deliver the most gains.
- Advanced techniques include inline critical resources and modern image formats.
- APIs like Performance & Navigation Timing offer precise data.
- Prioritize user interaction with techniques like requestIdleCallback.
- Foster a culture of continuous performance improvement.
Highly recommend this course for anyone serious about performance optimization!

Rohan Shakya
rohan-shakya
I've been binging Max Firtman's courses on Master.dev, Basics of Go, Vanilla JS and Web App Performance. Such amazing content, thank you!

Sam Kling
samklingdev