Bloomberg
Mastering Chrome Developer Tools, v4

3 hours, 44 minutes
CC

Course Description
Inspect, debug, and audit web apps faster with professional Chrome DevTools skills! Prototype UIs live in-browser with the DOM inspector. Go beyond console.log() with step-through debugging and track memory performance to identify bottlenecks in your code. Leverage the network panel and run Lighthouse reports to ensure your apps are high-performing and following the latest performance, SEO, and accessibility best practices.
This course and others like it are available as part of our Frontend Masters video subscription.
Preview
What They're Saying
I was surprised to know just how capable the DevTools are, and how resourceful they can be to debug and improve the performance of your applications.
Rohan Khalate
The course was foundational and easy to follow. While it focused on Vanilla JavaScript, I’ll definitely be exploring more techniques for mastering Chrome Developer Tools—especially those that pair well with React development. It was a great starting point, and I believe it takes time and practice to grow more comfortable with these tools and apply them effectively across different frameworks.

Michael Joshua Ramos
Course Details
Published: March 14, 2025
Rating
Learning Paths
Topics
Learn Straight from the Experts Who Shape the Modern Web
Your Path to Senior Developer and Beyond
- 250+ In-depth courses
- 24 Learning Paths
- Industry Leading Experts
- Live Interactive Workshops
Table of Contents
Introduction
Section Duration: 21 minutes
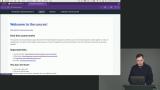
 Jon Kuperman introduces himself and discusses his experience working with TC39, the standards body behind JavaScript, and is a co-convener for source maps. Jon also provides links to the course code on GitHub, the slides, and the deployed code.
 Jon explains key reasons why mastering Chrome DevTools is valuable including becoming a web performance expert, quickly fixing complex bugs, and helping prototype quickly by providing tools for HTML and CSS editing, console operations, and JavaScript editing.
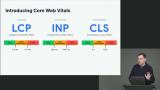 Jon discusses the concept of Core Web Vitals, which are important metrics for measuring website performance. He explains three key metrics: Largest Contentful Paint (LCP), First Input Delay (FID), and Cumulative Layout Shift (CLS). Jon also mentions the importance of real user data and suggests using monitoring tools to collect performance metrics from actual users.
What Can Chrome DevTools Do?
Section Duration: 36 minutes
 Jon explains the Elements panel, which displays the HTML rendered as DOM on the left and the attached styles on the right. He demonstrates how to navigate and edit elements and styles, and highlights features such as computed styles and the box model. Jon also mentions the ability to simulate events, add classes, and emulate different rendering scenarios.
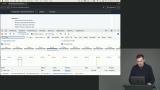 Jon discusses the "DOMContentLoaded" and "load" events, and the columns available in the Network tab. He also mentions that the Network tab displays request and response headers, which can be useful for checking server headers and client-side fetch calls.
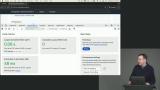 Jon demonstrates how to use the Performance tab to analyze the main thread of a web application, which is where JavaScript code runs. He explains the concept of multi-threaded JavaScript and how it allows for non-blocking tasks using workers. Jon also discusses the color schemes used in the Performance tab and explains the difference between total time and self time when analyzing function performance.
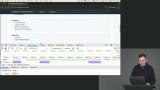 Jon introduces the Chrome DevTools console, demonstrates how elements can be selected and manipulated in the console, and how issues can be identified and resolved using the console. He also introduces the Sources tab, which functions as a full IDE where HTML, CSS, and JavaScript files can be edited.
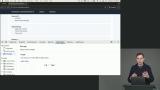 Jon explains that the Application tab in the browser's developer tools is where you can inspect and edit data stored within the browser, such as cookies, session storage, local storage, and IndexedDB. The tab also allows you to browse tables of key-value pairs for sites that use local storage or session storage, simulate offline mode for service worker testing, and inspect the manifest of progressive web apps.
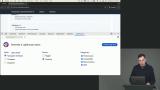 Jon explains that the Lighthouse tool allows users to perform a full audit of their website, simulating mobile or desktop devices and evaluating performance, accessibility, best practices, and SEO. He also mentions that Lighthouse offers features like viewport device simulation and network throttling.
Essential Chrome DevTools
Section Duration: 30 minutes
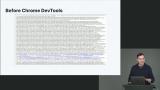 Jon provides a brief history of developer tools for the web, starting with the raw HTML and the use of alert statements for debugging. Jon emphasizes that the evolution of devtools was a collaborative effort by Microsoft, Mozilla, and Google, and mentions the recent development of developer browsers like Sysy and Polypane.
 Jon explains the distinction between HTML and the document object model (DOM), where the elements panel shows the rendered and interactive DOM with applied CSS and JavaScript. Jon also discusses CSS specificity and the battle that occurs when multiple selectors apply to an element, highlighting the importance of understanding specificity rules.
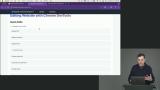 Jon demonstrates some tips and tricks for efficient web development including, how to navigate the Elements panel, add new CSS rules, simulate states, view computed styles, find event listeners, change color formats, and import custom themes. These features provide developers with powerful tools for debugging and optimizing their web applications.
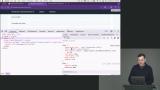 Jon introduces the accessible color picker and explains that it is important to ensure that the contrast of colors used in web design is accessible to people with different visual conditions. By enabling the experiment and clicking on a color, developers can see the contrast ratio and determine if it is compliant.
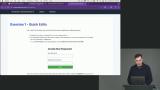 Jon introduces the first exercise and instructs students to use the Chrome DevTools to make changes to a website. The exercise involves changing an ordered list to an unordered list, fixing a password field that doesn't allow pasting, and finding a card with a specific ID. Jon demonstrates different ways to solve each task, highlighting the flexibility and interconnectedness of HTML, JavaScript, and CSS.
Network Performance
Section Duration: 48 minutes
 Jon explains that the DevTools can provide detailed information about network requests, such as the size, time, and where the time was spent. Jon discusses the concept of the website waterfall, where different assets are loaded in a specific order. He also mentions the importance of browser caching and introduces compression techniques like gzip and Brotli, which can reduce the size of files transferred over the network.
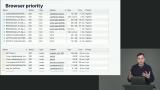 Jon explains the concept of browser priority, which determines the order in which assets are downloaded. He discusses the use of APIs like preload and prefetch to override default priorities and improve the loading of high-priority assets. Jon also mentions the importance of measuring and optimizing performance to avoid blocking the UI.
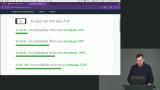 Jon demonstrates how to use the network panel in Chrome DevTools to analyze network performance. He shows how to identify resources that are taking a long time to load, such as images and JavaScript files, and explains how to use the timing feature to understand where delays are occurring in the network traffic.
 Jon introduces Lighthouse Web Audits as a tool for analyzing the performance characteristics of web applications. Lighthouse evaluates various categories such as performance, accessibility, best practices, and SEO, providing insights into page load speed, responsiveness, compatibility with assistive technologies, code quality and security, and search engine optimization.
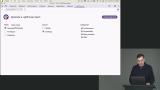 Jon demonstrates how to use Lighthouse audits to analyze the performance, accessibility, best practices, and SEO of a website. He explains that Lighthouse provides diagnostic suggestions and recommendations for improving these areas, along with links to documentation for further understanding. Jon emphasizes the importance of running Lighthouse audits to identify areas that need attention and improve website performance.
 Jon discusses the results of a Lighthouse audit on a sample page, pointing out issues related to page load speed, accessibility, best practices, and SEO. He also explains how to use Chrome DevTools to get a more detailed view of unused JavaScript and CSS.
Step Through Debugging
Section Duration: 21 minutes
 Jon introduces step-through debugging, explaining that it allows developers to pause and inspect their code as it executes. Jon emphasizes that step-through debugging is not time traveling and cannot go back in time, but it provides a lot of information about the code's execution flow.
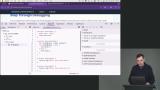 Jon demonstrates how to set breakpoints, use conditional breakpoints, and navigate through the call stack. He also explains how to use the watch panel to inspect variables and the scope panel to see the variables available at a specific point in the code.
 Jon introduces an exercise to practice using the debugger to identify and fix bugs. Jon demonstrates how to set breakpoints, explore the call stack, and make code changes to resolve the issues. He emphasizes that while console logging is powerful, using the debugger can provide more robust information, especially in cases where console logging may be time-consuming or insufficient.
Performance Profiling
Section Duration: 33 minutes
 Jon discusses measuring page performance with RAIL (response, animation, idle, load). He also explains that interactions should feel instant if they occur within 100 milliseconds, and anything beyond one second can lead to user frustration.
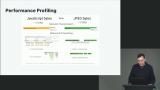 Jon emphasizes the importance of being cautious with JavaScript and suggests considering solutions like chunking work, using web workers, and doing less work to avoid page jank. Jon also introduces the concepts of requestAnimationFrame and CSS transforms as tools to optimize performance by batching and avoiding constant invalidation and repaints.
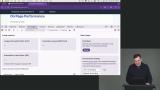 Jon demonstrates how to use the Performance tab in the browser's DevTools to analyze the performance of a web application. He explains that the red bars indicate tasks that took longer than the allotted time, but it doesn't necessarily mean there is page jank. Jon also provides tips on collecting performance snapshots and navigating the different views in the Performance tab.
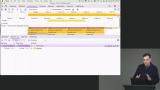 Jon introduces an exercise that involves observing an animation that is struggling and then optimizing it to run faster. The goal is to determine if frames are being dropped and identify any performance issues. He also discusses the importance of recording and comparing performance profiles to track improvements.
Memory
Section Duration: 23 minutes
 Jon identifies several common categories of memory leaks, including accidental global variables, closures, event listeners, set intervals, and detached DOM nodes. Jon also mentions the importance of using cleanup techniques provided by frameworks, such as Angular's OnDestroy hook, to remove event listeners and dispose of unnecessary resources.
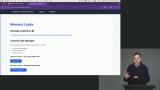 Jon discussing identifying memory leaks in Chrome DevTools and suggests using the task manager to monitor memory usage in browser tabs and the performance tab to track memory over time. By observing patterns and looking for steady state memory usage, developers can identify potential memory leaks in their applications.
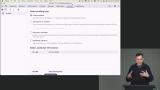 Jon explains how to use the memory tab in the Chrome DevTools to analyze memory usage in JavaScript applications. He discusses concepts such as shallow size and retained size, and explains the mark and sweep garbage collection algorithm used in JavaScript. Jon also provides tips on how to interpret the memory snapshots and identify potential memory leaks in the application code.
 Jon introduces the memory leak exercise and encourages students to use tools like the task manager and performance analyzer to visualize memory usage and run heap snapshots. He also demonstrates using the task manager and performance tab to identify memory leaks and analyze heap snapshots.
DevTools Experiments
Section Duration: 6 minutes
 Jon discusses Chrome DevTools experiments, which are experimental features that can be enabled in the DevTools settings and AI innovations in DevTools including console insights and AI assistants.
Wrapping Up
Section Duration: 1 minute
 Jon wraps up the course by answering student questions regarding electron devtools and collating coverage across multiple pages.
Learn Straight from the Experts Who Shape the Modern Web
- 250+In-depth Courses
- Industry Leading Experts
- 24Learning Paths
- Live Interactive Workshops