Continue Course
Nice Work!
You have completed Design for Developers
|
|
Design for Developers
Learn how to become self-sufficient for the entire process of execution from concept to design to implementation. Also, understand the rules for designing to become a better collaborator to design team members and better able to execute the creation of complex and beautiful front-end experiences!
Course Progress
Lessons Completed
0
Lessons Remaining
0
Time Remaining
0 hr 0 min
0% completed
0% remaining
Course Detail
Published: January 13, 2019
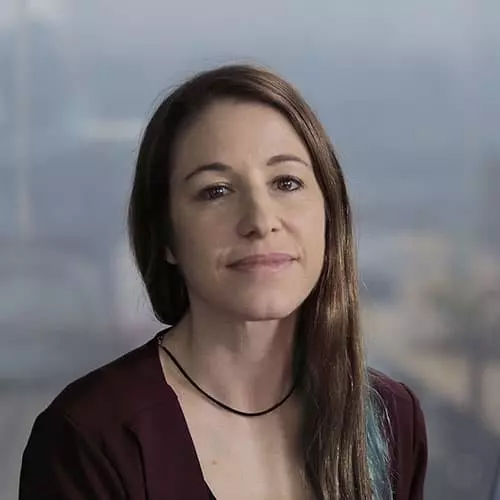
Sarah Drasner
Sarah is a Distinguished Engineer, and Area Tech Lead for AI and the Web Ecosystem for Chrome at Google. She’s formerly Sr. Director of Engineering at Google, leading the Core Infrastructure teams that power Google apps (Search, YouTube, Workspace, Cloud, etc) on the Web, Android, iOS, Multiplatform, Experimentation, and Client Observability. She was Incident Commander for Core Developer Infrastructure at Google and led the Search mission for Core Developer, modernizing and innovating Google’s internal tech stacks for the age of AI.
Sarah Drasner is an award-winning Speaker, and she was formerly VP at Netlify and Principal at Microsoft Azure. Sarah is an instructor at Master.dev, and has written two books."