Request Metrics
Debugging and Fixing Common JavaScript Errors

3 hours, 39 minutes
CC
Course Description
Stomp out bugs and clean up JavaScript apps! In this course, Todd Gardner (Co-founder of TrackJS), walks through common JavaScript bugs and how to isolate and fix the source of the problems. By coding along, you'll learn the four stages of a debugging cycle needed to fix bugs. Use Chrome Dev Tools, debugger, network profile and more to fix memory leaks, performance problems, network failures and more! This course is for any JavaScript developer that builds, maintains, or tests an application that uses JavaScript. With the knowledge you gain, you’ll be armed to find and squash those bugs faster and for good!
Preview
Course Details
Published: May 22, 2017
Rating
Learning Paths
Topics
Learn Straight from the Experts Who Shape the Modern Web
Your Path to Senior Developer and Beyond
- 300+ In-depth courses
- 24 Learning Paths
- Industry Leading Experts
- Live Interactive Workshops
Table of Contents
Debugging JavaScript
Section Duration: 19 minutes
 Todd H. Gardner introduces his Debugging JavaScript course and agenda, which covers the process of finding bugs and the concepts to consider when working through the course of removing a bug.
 After pulling a volunteer from the audience, Todd tests a student's knowledge to highlight the bizarre quirks in the JavaScript language.
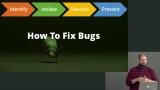 Todd reviews a four stage of a debugging cycle to fix bugs: Identify, Isolate, Resolve, and Prevent.
Fixing Bugs
Section Duration: 6 minutes
 Todd introduces the demo application, getRANTr, that is used throughout the course. NOTE: We recommend using Node version 8.17.0 for this course.
 After the students have installed the application as the learning tool, Todd shows how the application is built and which code sections students should focus their attention.
First Bug
Section Duration: 26 minutes
 Using Chrome DevTools, Todd demonstrates how to identify a bug by setting up persistent authoring to see changes immediately and save those changes to disk.
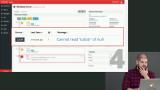
 In this challenge, students need to identify and fix a "Cannot Read Property" bug.
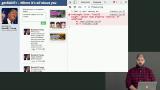 Todd walks through the solution to Challenge 1 of function context by enabling async call stacks and blackboxing scripts in Chrome DevTools.
Second Bug
Section Duration: 9 minutes
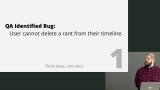
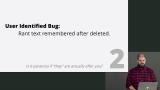 In this challenge, students identify and resolve a bug of persisting text.
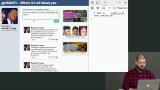 Todd walks through the solution to Challenge 2 covering empty strings and falsy values.
Third Bug
Section Duration: 15 minutes
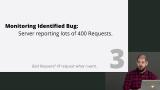 In this challenge, students identify and resolve a user-form validation bug.
 Todd answers questions from students about the first Challenge and how to remove extra event listeners added by frameworks.
 Todd walks through the solution to Challenge 3 by using the Network Inspector, response previews, and JavaScript debugger and then Todd takes questions from students.
Fourth Bug
Section Duration: 10 minutes
 In this challenge, students attempt to determine why a user's data is not showing up.
 Todd walks through the solution to Challenge 4 by using the Network Inspector, response previews, and JavaScript debugger.
JavaScript Quirks
Section Duration: 7 minutes
 Todd pulls another volunteer from the audience to review JavaScript quirks.
Fifth Bug
Section Duration: 31 minutes
 Demonstrating how to use Profiler and Timeline recordings in Chrome DevTools, Todd shows how to spot memory bugs in an application.
 In this challenge, students attempt to verify the memory leak is occurring with Chrome DevTools and pinpoint in the code where the leak is happening.
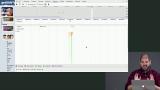 Todd walks through the solution to Challenge 5.
Sixth Bug
Section Duration: 18 minutes
 Using screenshots capability in Chrome DevTools, Todd shows how to illustrate a page rendering over time along with network activity.
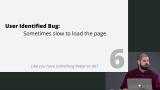
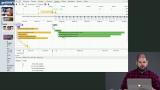 In this challenge, students identify the biggest impact in load performance of the application using DevTools throttling and screenshots
 Todd walks through the solution to Challenge 6 by looking for potential impacts in load performance of the application.
Seventh Bug
Section Duration: 13 minutes
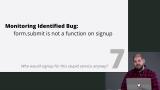 Inspecting a code error, Todd determines a bug is occurring due to a third party vendor's code.
 In this challenge, students attempt to find out how to resolve a bug resulting from a third party vendor's code.
 Todd walks through the solution to Challenge 7 by finding DOM inconsistency.
Eighth Bug
Section Duration: 24 minutes
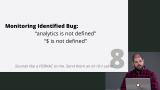 When a user has a bad experience with an application due to a third party script, Todd shows how to locate the error through load checking, simulating network speeds, and blocking scripts through a proxy.
 In this challenge, students record an error has occurred and attempt to improve the user experience.
 Todd walks through the solution to Challenge 8 by incorporating a failback when a third party code on a CDN fails to load.
Design for Debuggability
Section Duration: 35 minutes
 Todd answers questions from students about calling global objects, debugging bundled scripts, and setting cache timeouts.
 Talking about monitoring for bugs within a web application, Todd reviews how to find bugs sooner and therefore cheaper.
 Todd discusses when to refactor code and introduces the concept building a debug mode in an application.
 Todd extolls the virtue of setting up an update testing cycle when releasing code updates to lower the risk of change.
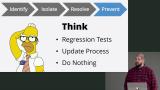 Thinking about how to prevent bugs from entering the code, Todd talks about introducing regression tests and updating processes as possible solutions realizing there is a cost associated with each.
Wrapping Up Debugging JavaScript
Section Duration:
 Todd reviews the course agenda and concludes the course.
Earn a Completion Certificate
After completing this course, you'll receive a certificate of completion that serves as proof of your achievement, showcasing your expertise, and commitment to professional development. You can easily share this certificate on your LinkedIn profile to highlight your new skills and demonstrate continuous learning to potential employers and professional connections.