Data Sketches
Introduction to D3.js

5 hours, 59 minutes
CC

Course Description
Learn D3.js, a JavaScript library for producing dynamic, interactive data visualizations on the web. D3.js can be intimidating, so this is a fun, approachable introduction to SVG and D3! In this course, you'll get hands-on experience with data binding and learn how it works with the enter-update-exit pattern, build a full chart with scales, and learn to animate between different D3 layouts for truly interactive visualizations – bring your data to life!
Preview
Course Details
Published: September 25, 2020
Rating
Learning Paths
Learn Straight from the Experts Who Shape the Modern Web
Your Path to Senior Developer and Beyond
- 300+ In-depth courses
- 24 Learning Paths
- Industry Leading Experts
- Live Interactive Workshops
Table of Contents
Introduction
Section Duration: 18 minutes
 Shirley Wu introduces the course material, explains that D3 is going to be the main JavaScript library used in this course, and mentions that this course will give students a solid understanding of Scalable Vector Graphics (SVG).
 Shirley gives an overview of the main lessons and takeaways of the course, and outlines a few resources for working with the D3.js library used in the course.
SVG
Section Duration: 45 minutes
 Shirley discusses the main differences between Scalable Vector Graphic (SVG) and Canvas HTML, explains when it is best practice to use each, and answers a student question regarding transforming illustrator files into SVG files.
 Shirley defines the SVG viewport as a window that has a width and a height, explains that x coordinate value increases going right and y value increases going down, and covers a few examples of the most popular SVG elements and their attributes.
 Shirley breaks down drawing a flower petal in SVG into a step by step process, and explains the different commands contained within the SVG attributes, namely move to, line to, and curve to.
 Shirley demonstrates how to create an SVG path using the example of a smiley face, and utilizing the move to, line to, and curve to attributes.
 Students are instructed to create a flower petal by first sketching it on paper, and then writing down an SVG path.
 Shirley shares a possible solution to the SVG Shape exercise created by one of the students.
API
Section Duration: 1 hour, 1 minute
 Shirley explains that D3 is a comprehensive library for manipulating documents based on data and shares three main sections of the library the course focuses on: DOM manipulation, forces, and finishing touches.
 Shirley explores two different D3 selections, select() and selectAll(), and demonstrates what a D3 selection looks like under the hood, which is useful to know when debugging an SVG. A few selection methods that either take in a selector string or a DOM element and returns a D3.js selection are reviewed in this segment.
 Shirley demonstrates how to bind data to selectors, explores different ways to bind data to selectors, and explains how that changes the SVG.
 Shirley explains that once data bounds have been selected, developers can use them within a DOM element using the .attr() and .style() methods that set either the attribute or the CSS styles on elements. How to add attributes and styles to an SVG is also demonstrated.
 Shirley demonstrates how to use attribute and style methods along with data binding to modify or create an SVG.
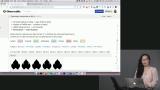 Students are instructed to add colors to the petals created in a previous segment by modifying the attributes and styles of the SVG.
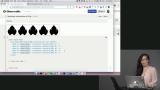 Shirley live codes the solution to the attr & style exercise.
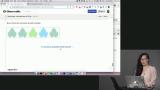 Shirley reminds students that D3.js stands for data-driven documents because data drives what is created in the DOM. Covered in this segment is why the selector in selectAll(selector) must match what is appended, a breakdown of how D3 returns .data(data), and an explanation of how .enter() contains five
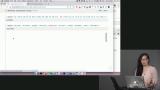 Students are instructed to create a flower petal for each movie, color the petals by movie genre, and select the type of petal by parental rating.
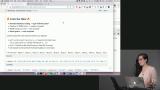 Shirley live codes the solution to the previous exercise after answering questions about the type of data passed into the DOM within the array, and about the width and height that are set up when creating an SVG.
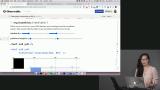 Shirley explores the translate() method of transformation, and explains that using translate() modifies the coordinates of that element, and adds that translate is useful when positioning an element with precision.
Specifications
Section Duration: 37 minutes
 Shirley explains that D3.js scale functions can be used to translate raw data into visual channels, and shares some examples of visual channels such as position, size, color, and shape. Examples of data types are also shared in this segment, namely quantitative, temporal, spacial, nominal, and ordinal data types.
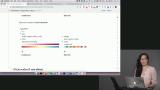 Shirley shares examples of the most commonly used scales that translate data types into visual channels, and explains when and how to use them.
 Shirley breaks down the process of adding scale to an element using the select, selectAll, data, enter, and append methods. Scales transform data values into visual variables.
 Students are instructed to render movies into the visual channels by converting the raw movies data including genre, ratings, and votes into the visual channels.
 Shirley live codes the solution to the Scales exercise.
 Shirley explains that it is best practice to first translate the element and then scale afterwards, and adds that the order in which translate and scale are used within transforms is important. The order of the coordinates is important when using scales, because it determines where an element is placed.
Group Elements
Section Duration: 35 minutes
 Shirley explains that group elements are used to amass other elements together, making them easier to manipulate, and demonstrates how to build a group element.
 Shirley explains that each film flower has a different number of petals depending on the data used to generate that flower, and adds that to create the correct number of paths, developers can use the selection pattern shared in examples from the previous lesson. The fact that .data() accepts functions and that functions return an array of objects is also discussed in this section.
 Shirley live codes an example of a group element within an SVG, uses the .select().selectAll().data().enter().append(g) pattern, and adds a path and colors to the SVG.
 Shirley continues to live code the previous SVG example by adding a text element to the code to render movie titles, and modifies some of the styles to make the titles more readable.
 Shirley explorers rotate, one of the SVG transform methods, and demonstrates how to rotate around an SVG by changing the x and y coordinates.
DOM Manipulation
Section Duration: 25 minutes
 Shirley explains that the .data() function not only binds data to a selection and calculates the enter selection, it also calculates the update and exit selection, with the help of a key function. How to use the enter-update-exit pattern when modifying an SVG element is also discussed in this segment.
 Shirley explains that there are two valid ways to update the DOM that lead to the same result. There is an old way that consists in using the .exit() method and removing elements that are no longer needed, and creating new elements. The new way uses the .join() method, which is the equivalent of running both enter and exit methods, and therefore saves lines of code.
 Students are instructed to use the enter-update pattern to create a simple bar chart using both the old way and new way of updating data discussed in the previous segment.
 Shirley live codes the solution to the Enter Update exercise, and explains that the enter-update pattern is a powerful tool when combined with transitions that are discussed in the next section.
Transitions
Section Duration: 52 minutes
 Shirley explains that D3 transitions are how attributes and styles are animated from one state to the next, adds that transitions are important in data visualization because they maintain object constancy, meaning they record all of the visual updates happening from the first data set to the last one.
 Students are instructed to add transitions to animate the bar chart started in the previous lesson so that entering bars animate up, updating bars animate to their new positions, and exiting bars animate back down.
 Shirley live codes the solution to the animate with transitions exercise.
 Students are instructed to use .join() to update the flower display every time the movies are filtered, and to add animations so that on every update, the entering flowers fade in, the updating flowers animate to their new positions, the exiting flowers fade out.
 Shirley live codes the solution to the Filtering & Updating data exercise.
 Shirley continues live coding the solution to the Filtering and Updating Data exercise by adding animation to the list of flowers filtered by parental guidance ratings.
Positioning Functions
Section Duration: 41 minutes
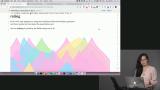
 Shirley introduces D3 shape functions, which help calculate the path strings that are needed to draw line charts, area charts, and pie charts. Shapes take in raw data and return path strings.
 Shirley explains that D3 hierarchy is a nested data structure that helps calculate the x, y-positions and, when applicable, the width, height, radius for trees, tree maps, and circle maps. D3 hierarchy takes in raw data and return new objects using functions without mutating the original data.
 Shirley explains that the D3 force layout is a layout module that is different from other modules because it mutates the data that is passed in, and requires thousands of calculations instead of a single one.
 Shirley explores various force layout examples, such as data visualization of the Hamilton musical that uses the force layout to group lyrics from the same song together, and a data visualization of how a pandemic might spread through a community. The example uses D3 force to link dots to specific houses within a community.
 Shirley demonstrates how raw data is translated into flowers that represent movies, with titles, genres, and links between movies with similar genres.
 Shirley demonstrates how to add animation to the graph developed in the first part of the Force Practice segment by using the D3 force layout.
D3 & HTML
Section Duration: 27 minutes
 Shirley copies the D3 bar chart code written in a previous segment, moves it into an HTML file, and demonstrates how to refactor the file so that the D3 bar chart is rendered.
 Shirley copies the D3 movie visualizations code representing movies as flowers within an HTML file, and refactors the code to render the visualization.
 Shirley refactors the code by adding the proper width and height to the D3 data visualization example started in the previous segment.
Wrapping Up
Section Duration: 12 minutes
 Shirley answers questions from the audience about available sites to find open data, how to use canvas with SVG, and shares other courses available on Frontend Masters for students to further their knowledge in D3, and thanks the students.
Earn a Completion Certificate
After completing this course, you'll receive a certificate of completion that serves as proof of your achievement, showcasing your expertise, and commitment to professional development. You can easily share this certificate on your LinkedIn profile to highlight your new skills and demonstrate continuous learning to potential employers and professional connections.

What They're Saying
If you're like me and struggling with the basics of D3.js I strongly advise you to consider taking this course Introduction to D3.js by Shirley Wu. I lost count of the amount of "aha moments" I had.

Justin
JFrazierDev