Data Sketches
Building Custom Data Visualizations

4 hours, 24 minutes
CC
Course Description
Make your data visualizations designs a reality with D3.js, a JavaScript library for producing dynamic, interactive data visualizations on the web! By coding along with Shirley Wu, you will go through basic visualization principles needed for designing custom data visualizations and delve into the D3.js modules, SVG, and web technologies that are necessary to make advanced data visualizations designs.
Preview
Course Details
Published: September 11, 2018
Rating
Learning Paths
Topics
Learn Straight from the Experts Who Shape the Modern Web
Your Path to Senior Developer and Beyond
- 300+ In-depth courses
- 24 Learning Paths
- Industry Leading Experts
- Live Interactive Workshops
Table of Contents
Introduction
Section Duration: 15 minutes
 Shirley Wu introduces Building Custom Data Visualization workshop. Shirley talks about the three workshops she has created with Frontend Masters, and the order she recommends in taking those classes, as well as her thoughts while creating this course.
 Shirley discusses the two significant categories of custom data visualizations: exploratory and expository. It's explained why we will be using expository examples today, but that they are easily transferrable to exploratory data visualizations.
 Shirley gives the roadmap for how the course is structured.
Data
Section Duration: 1 hour, 34 minutes
 Shirley goes through the steps that she takes when approaching a new dataset to turn into a data visualization. Observable Notebook is introduced, and a short instruction on how to use it is given.
 Shirley briefly goes over the different data types. To understand a dataset, students go through and writing down the data attributes and listing some data comparisons that may yield interesting results.
 Shirley works through the dataset by listing the data type for each of the useful data attributes, then listens to the audience's suggestions for worthwhile questions about the data to explore.
 Shirley records the potential questions from the previous section, and gathers more questions and hypotheses around that dataset that seem interesting.
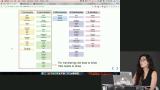
 To help figure out the best way to explore questions from the datasets, Shirley reviews common chart types that lend themselves well to the data types discussed earlier, and a tool called Vega-Lite that helps with graphing the data for exploration.
 In this exercise, the audience is instructed to brainstorm and sketch possible chart types that will aid in answering questions they have about the data.
 Shirley reviews the audience's brainstorming chart sketches that explore potential ideas to visualize the data.
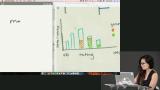 While using a chart idea from the previous exercise, Shirley demonstrates the process of generating a scatterplot visualization in Vega-Lite.
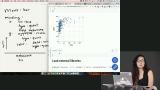 Shirley leads a discussion about what are some interesting aspects of the chart that, through further exploration, may lead to interesting results.
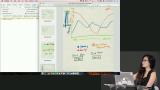 Shirley reviews another student's brainstorming sketch and transforms the idea into a Vega-Lite line chart.
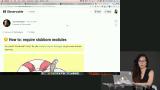 Shirley introduces how to require modules in Observable, and demonstrates how the module require debugger tool works for modules that are more difficult than others.
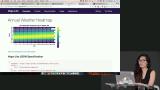 Shirley demonstrates how to generate heatmaps with Vega-Lite displaying the release date and genre of blockbuster movies.
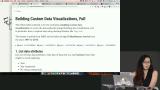 Shirley reviews the methods that she went through to explore the data that the audience had previously done, and the thought process throughout. The audience is asked to jot down a few points they though were interesting, and things they think are important to keep in mind when exploring datasets. Further advice is given when exploring a dataset.
Design
Section Duration: 51 minutes
 Once a question or hypothesis is answered, or something interesting is found, Shirley suggests to build a story around that theme thinking through how to translate that story into visual encodings.
 In this section, the design of the visualization is also introduced. Shirley explains what marks and channels are, how they differ, and then introduces the impacts of the various channels. Within this section, Tamara Munzer's Visualization Analysis and Design is referenced as the inspiration for many of Shirley's points.
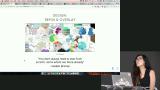 Shirley covers the Gestalt principles of proximity, similarity, and exclosure that help explain how to utilize how the brain processes patterns for designing data visualizations.
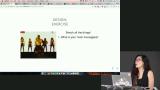 Shirley urges gaining inspiration from work that has done before rather than attempting to start from scratch.
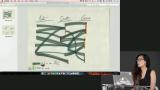 In this exercise, the audience is asked to brainstorm a complete data visualization idea, including a main message, marks, and channels.
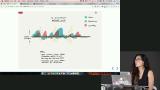 Shirley reviews sketches from students and discusses their messages they want to convey in their designs.
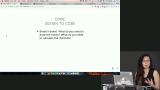 Shirley introduces the graph that will be built throughout the rest of the class.
Code
Section Duration: 52 minutes
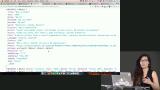
 Shirley explains the two parts to turning designs into code, which are drawing the geometric shapes, then translation from the data into their various channels.
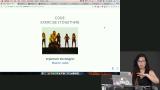 Shirley points out key portions of the D3 API that assist in data preparation, layout calculation, and user interactions. Applications of these concepts created by Shirley (and others) are demonstrated to help the audience understand the process of understanding in what way the data is best represented before approaching the D3 library for a solution.
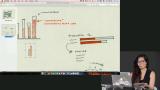 The premise of this exercise is to code a D3 chart based on sketch by Shirley using the movie dataset.
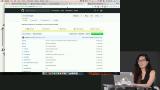 After explaining the distribution of the data, and introducing D3 Areas as the main method to form the visualization, Shirley live codes the chart solution.
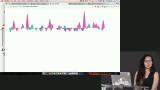 Continuing with the previous coding solution, Shirley refines her chart by adding curves and a color scheme.
The Finishing Touches
Section Duration: 44 minutes
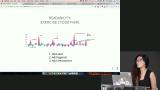 Shirley stresses the importance of readability in data visualizations. Shirley references several D3 Libraries created by Susie Lu that aid in readability by providing context in the way of axes and annotations.
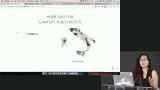 In this exercise, Shirley demonstrates how to use the libraries mentioned in the previous video to add axes, and annotations to the movie visualization chart for improved readability.
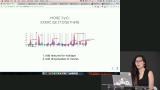 Shirley offers other ways to add aesthetics into charts with patterns, gradients, textures, SVG filters, and others. The work of Nadieh Bremer is introduced to help give context to the importance of these aspects.
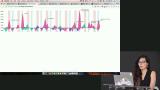 In this exercise, Shirley uses the Gestalt laws to strategically add texture using the textures.js library to the movie data visualization.
 After adding textures to the chart, Shirley instructs on how to add drop shadows to the movie titles.
 Shirley introduces interactions through D3. Simple interactions can be done with D3 alone, but more complex interactions have to have React (or similar) as an aid.
Wrapping Up
Section Duration: 5 minutes
 The process of the creation and utilization of SVG data visualizations at Netflix outlined in this section. Shirley gives sage advice that has been gained through working with the complex problems that have been encountered.
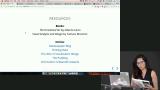 After listing many data visualization resources for the audience to utilize, Shirley wraps up the course by thanking contributors, her beta testers, and the audience.
Earn a Completion Certificate
After completing this course, you'll receive a certificate of completion that serves as proof of your achievement, showcasing your expertise, and commitment to professional development. You can easily share this certificate on your LinkedIn profile to highlight your new skills and demonstrate continuous learning to potential employers and professional connections.